
Steam pressure curve and phase diagram of water
Bild
Charts:
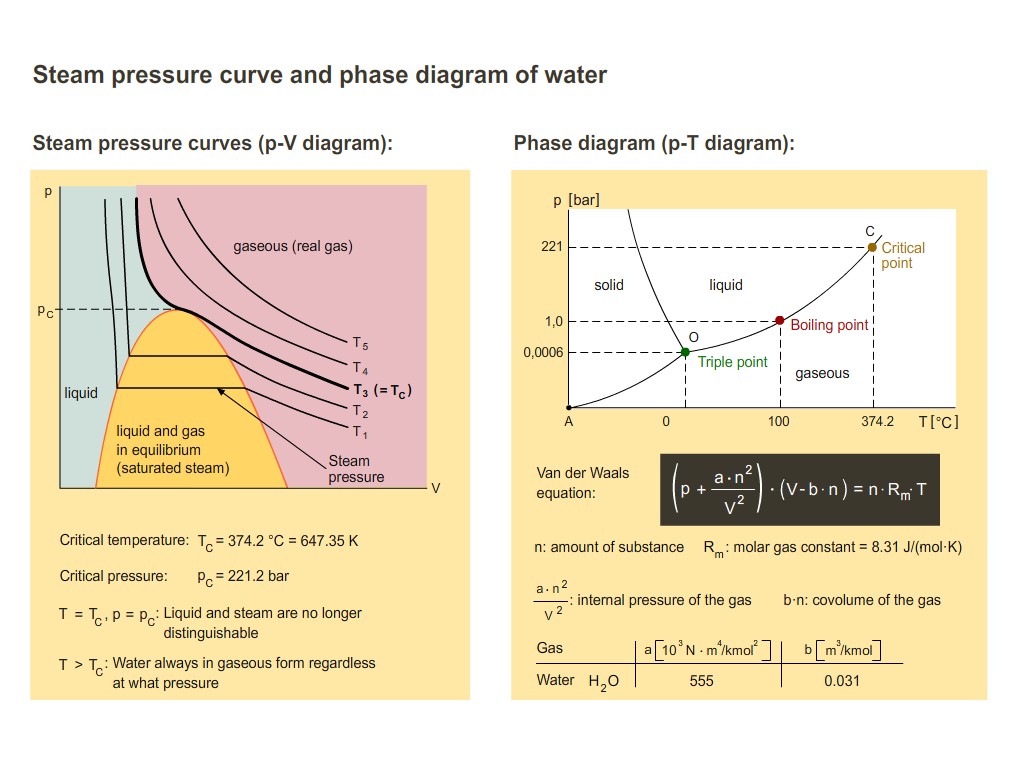
The steam pressure curves (p-V diagram) and the phase diagram (p-T diagram) of water are compared.
Englisch, Spanisch (CREA), Deutsch
01.08.2021

Dieses Medium steht unter einer CC BY-SA 4.0 international Lizenz.
Was bedeutet das?
So verweisen Sie auf das Medium
If you heat water to 100 °C at normal atmospheric pressure, it turns into steam. But what effect does raising or lowering the pressure have on the vaporization temperature?
The answer to this is given by the steam pressure curve (T-curves in the p-V diagram on the left) and the phase diagram (p-T diagram of the right) of the water. Steam pressure is the term for the pressure at which gas and liquid are in equilibrium, i.e. the same number of molecules evaporate as condense back into water. Above the critical temperature (numerical values are given) the water is always gaseous, regardless at what temperature, and it can be treated as a real gas (Van der Waals equation, formula is given). At every temperature below the critical temperature there is a steam pressure for which there is a two-phase zone (liquid and gaseous). In the liquid phase range it is possible to recognize from the steep rise in the curves that liquid substances are barely compressible.
The critical temperature must not be confused with the triple point temperature (see p-T diagram). This characterizes the values of temperature and pressure at which all phases (solid, liquid and gaseous) are present simultaneously.
Information and ideas:
At what temperature does water boil on Mount Everest? So-called “Steam pressure tables" provide information about this. It would also be interesting to refer to the phase transition points as temperature critical points. At the phase transition from liquid to gaseous the energy applied does not initially lead to an increase in temperature. The same applies to the melting of ice. Not until all the water has evaporated or melted does the temperature rise further.
Illustration
Chemistry; Physics; Technology
Grade 7 to 9; Grade 10 to 13
Middle/high school; Vocational training
Chart; Energy; State of aggregation; Steam engine; Turbine; Energy conversion; Graphics; Steam engine; Turbine
Siemens Stiftung Media Portal
MediaHouse GmbH
© Siemens Stiftung 2018