Big data – Introduction
Image
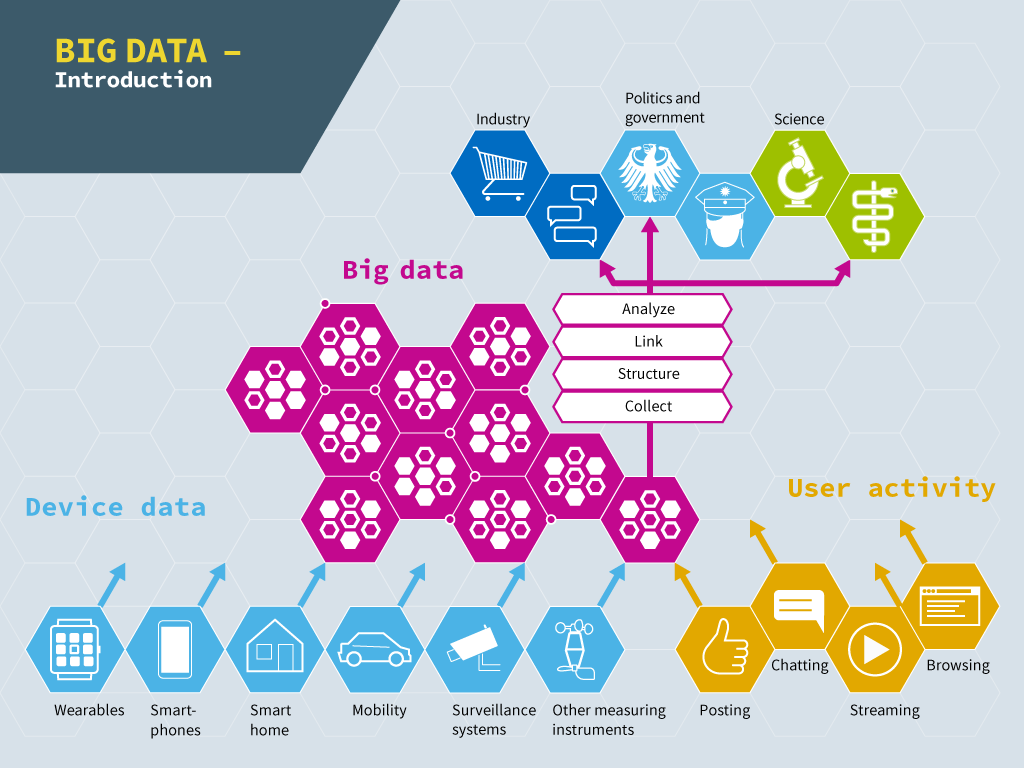
Graphic:
The graphic shows how the volume of data comes about in big data, what happens with it, and who uses it.
English, German, Spanish (CREA)
2020-02-27

This medium is made available under a CC BY-SA 4.0 international license.
What does this mean?
How to reference this medium
Information and ideas:
The graphic can serve as an introduction to the overall topic of big data by having the students describe the correlations they can recognize in the graphic and augment them with any prior knowledge.
The graphic can serve as an introduction to the overall topic of big data by having the students describe the correlations they can recognize in the graphic and augment them with any prior knowledge.
Illustration
Information and Communication Technology (ICT); Technology
Grade 7 to 9; Grade 10 to 13
Middle/high school; Vocational training
Computer technology; Data processing; Data protection; Internet
Siemens Stiftung Media Portal
Erfurth Kluger Infografiken GbR and irights-lab.de
© Siemens Stiftung 2019