English, Spanish (CREA), German
2016-06-15

This medium is made available under a CC BY-SA 4.0 international license.
What does this mean?
How to reference this medium
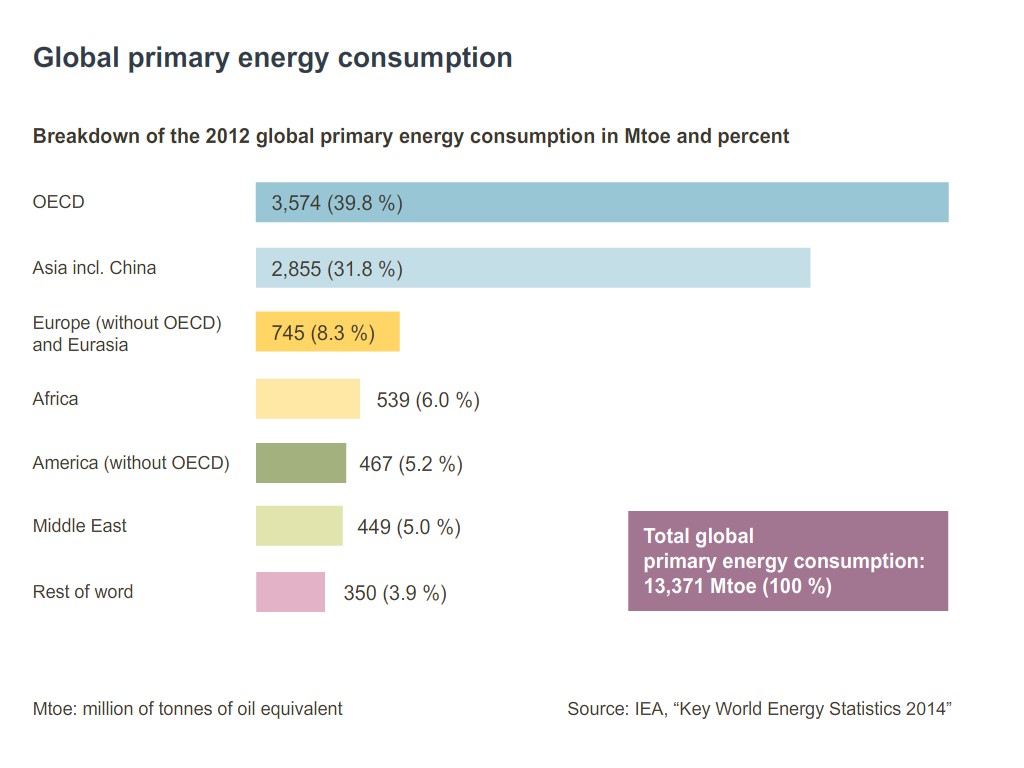
Chart:
A bar chart indicates the extent of primary energy consumption in millions of tonnes of oil equivalents (mtoe) of individual regions of the world and their percentage share of global energy consumption.
Information and ideas:
The following questions are good for a short presentation: Who or what is the OECD? What are the objectives of the OECD? Which countries are OECD members?
Using the following source: International Energy Agency (IEA)
Illustration
Geography; Technology
Grade 5 to 6; Grade 7 to 9; Grade 10 to 13
Middle/high school; Vocational training
Chart; Ecology; Energy
Siemens Stiftung Media Portal
MediaHouse GmbH
© Siemens Stiftung 2016