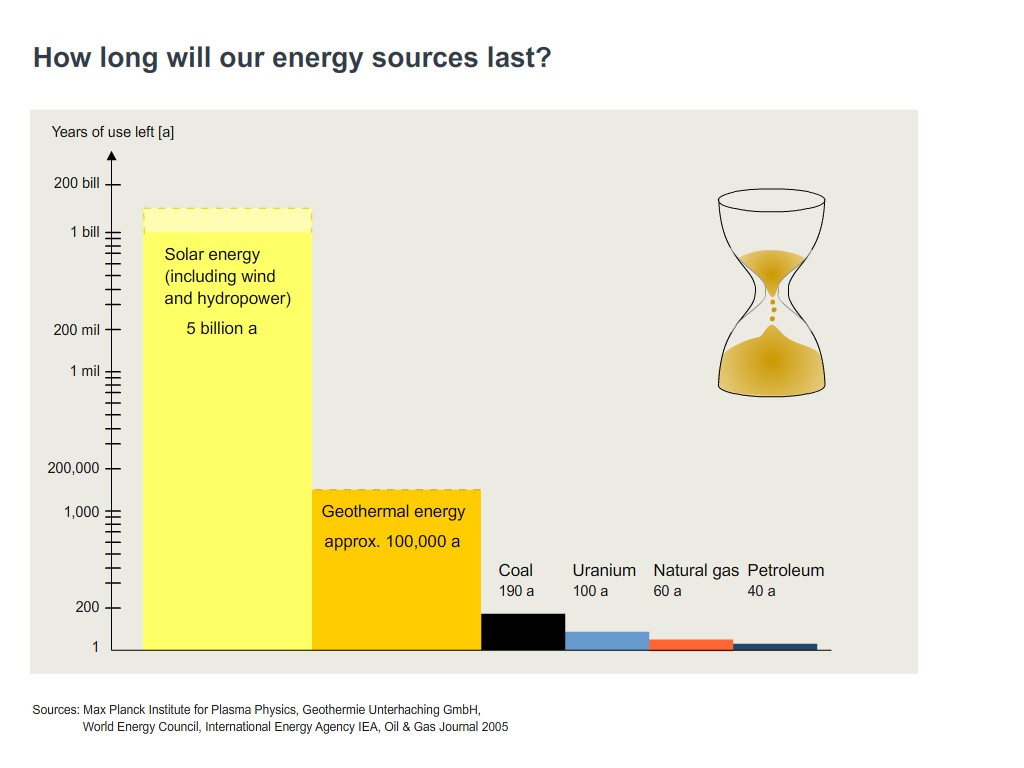
How long will our energy sources last?
Image
Chart:
A bar chart shows an overview of the remaining years of use of primary energy sources.
English, Spanish (CREA), German
2018-07-13

This medium is made available under a CC BY-SA 4.0 international license.
What does this mean?
How to reference this medium
Of the fossil energy sources, petroleum will be the first to run out. What is the situation for the other fossil energy sources? Can new technologies delay the point in time when they run out? And is it really true that renewable energy sources never run out?
The time axis has a logarithmic scale.
Information and ideas:
Students learn that the logarithmic scale represents numbers ranging over several powers. More in-depth information regarding how long energy sources will last is provided in the “An overview of energy sources” information sheet.
The time axis has a logarithmic scale.
Information and ideas:
Students learn that the logarithmic scale represents numbers ranging over several powers. More in-depth information regarding how long energy sources will last is provided in the “An overview of energy sources” information sheet.
Illustration
Geography; Technology
Grade 5 to 6; Grade 7 to 9; Grade 10 to 13
Middle/high school; Vocational training
Chart; Climate; Ecology; Energy; Environment (general); Environmental protection; Future; Renewable energy; Sustainable development; Climate protection; Ecology (environmental protection); Energy conversion; Environment; Forecast ; Graphics; Primary energy; Renewable energy; Sustainability
Siemens Stiftung Media Portal
MediaHouse GmbH
© Siemens Stiftung 2017