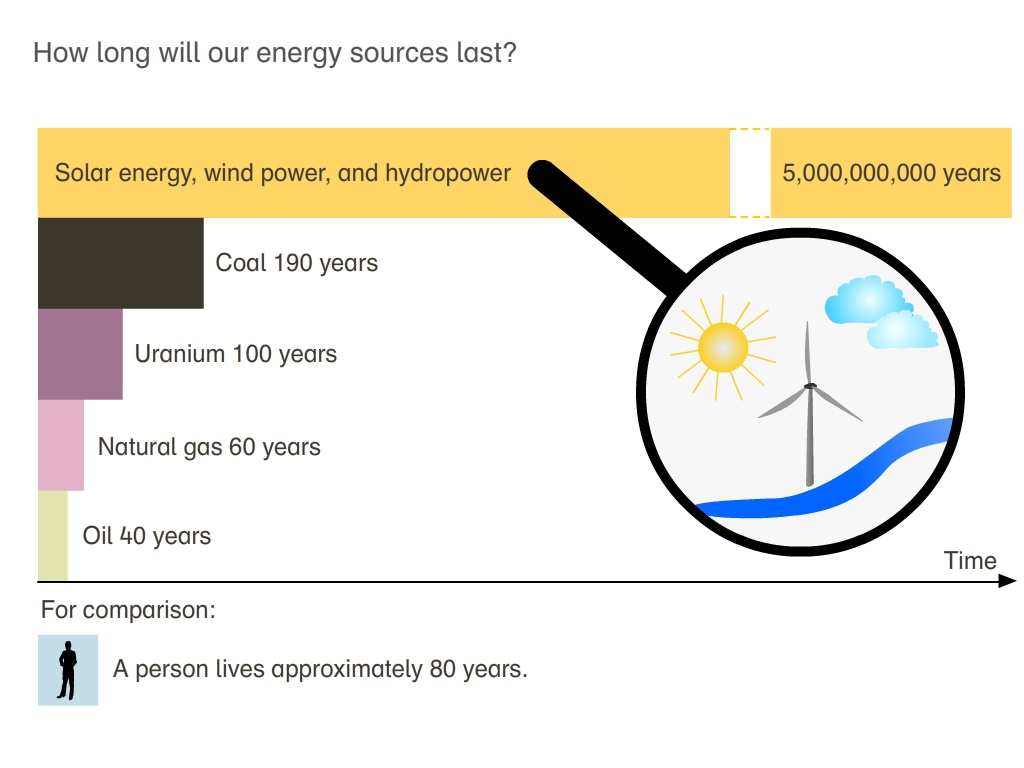
How long will our energy sources last? (ES)
Bild
Chart:
A bar chart shows an overview of the remaining years of use of energy sources.
Englisch, Spanisch (CREA), Deutsch
28.11.2018

Dieses Medium steht unter einer CC BY-SA 4.0 international Lizenz.
Was bedeutet das?
So verweisen Sie auf das Medium
Of the fossil energy sources, oil will be the first to run out. What is the situation for the other fossil energy sources? And is it really true that renewable energy sources will never run out?
As a comparison, the average lifespan of a person is shown below the bar chart.
As a comparison, the average lifespan of a person is shown below the bar chart.
Illustration
Personal, social and health education (PSHE)
Grade 1 to 4
Elementary school
Chart; Climate; Ecology; Energy; Environmental protection; Future; Power generation; Renewable energy; Sustainable development; Primary energy; Whiteboard-compatible
Siemens Stiftung Media Portal
MediaHouse GmbH using data from the Max-Planck-Institut für Plasmaphysik, Geothermie Unterhaching GmbH, the World Energy Council, the International Energy Agency (IEA), and Oil & Gas Journal 2005
© Siemens Stiftung 2018